Analytics
The Analytics page gives you a workspace-level view of activity over time.
nyayx.com/analytics
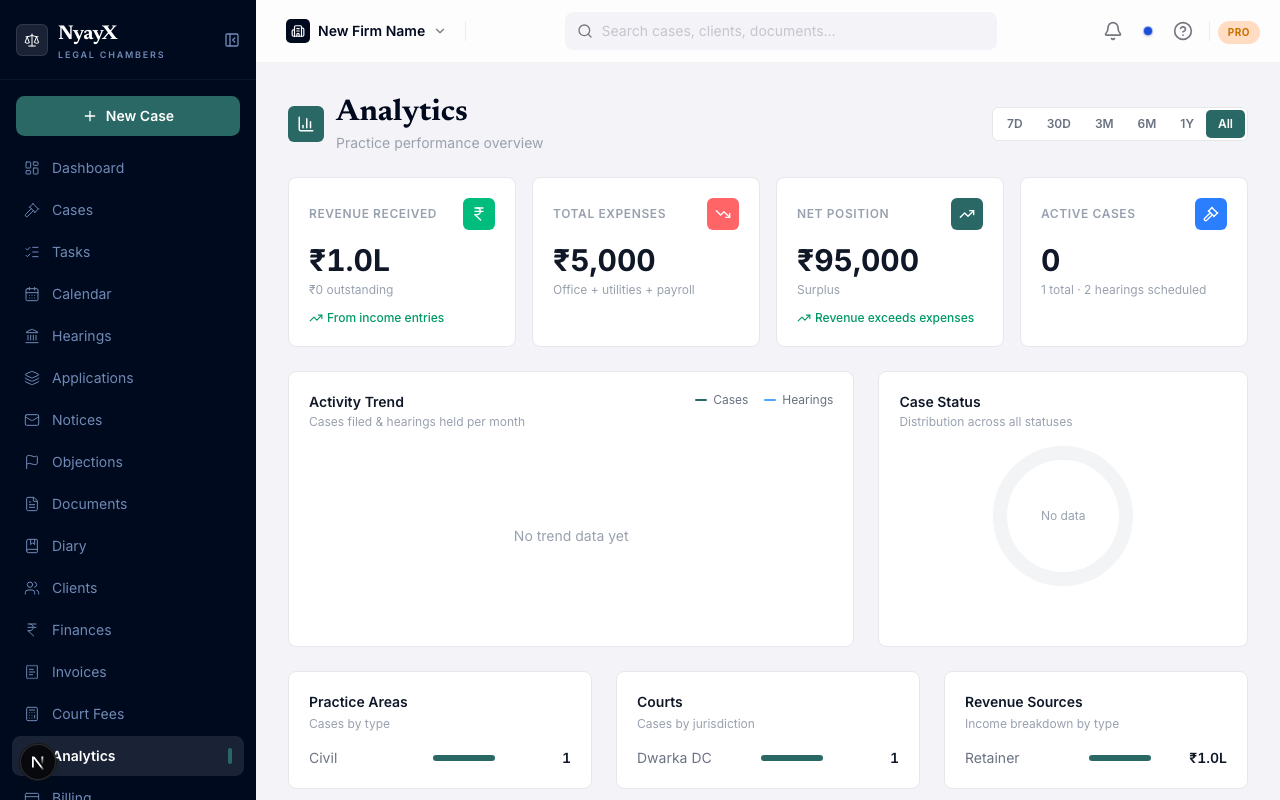
Analytics — activity charts and per-member breakdowns
What Analytics shows
| Section | Metric |
|---|---|
| Cases | Cases opened, disposed, active — by month |
| Hearings | Hearings logged per month, by court |
| Tasks | Tasks created vs. completed per member |
| Finances | Revenue billed and collected per month |
Time range
Use the Period selector (top right) to choose: Last 7 days, Last 30 days, Last 3 months, Last 12 months, or a custom date range.
Per-member view
Workspace Admins can see a per-member breakdown — how many hearings, cases, and tasks each team member has logged. This is useful for understanding workload distribution across the firm.